A ratio that indicates how well an investment fund, such as a hedge fund, performed in relation to the amount of risk it took.
The Calmar ratio is a formula that evaluates the success of an investment fund, such as a hedge fund, in relation to the amount of risk that the fund is exposed to. It is utilised in the process of evaluating the achievements of various hedge funds and in the selection of investment opportunities. If the ratio is high, it suggests that the investment has higher returns on a risk-adjusted basis over the period of time that was specified.
When comparing the performance of a CTA over the long term, the Calmar ratio, as opposed to the Sterling or Sharpe ratio, is the metric that is recommended. William Young, the founder of the newsletter Managed Account Reports, which was established in 1979 by publisher Leon Rose, is credited with popularising the concept.
California Managed Account Reports is an abbreviation that is abbreviated as the Calmar ratio. It is possible to use its performance as an indicator of how well a person's investments have done.
The Calmar Ratio is an important tool for determining the level of risk and potential return associated with an investment. It is computed using the compound annual rate of return as well as the maximum drawdown that has occurred over the course of the previous three years. If the ratio is higher, then it is reasonable to anticipate that the investment will produce better results on a risk-adjusted basis within the specified amount of time.
A portfolio's performance relative to its level of risk is evaluated using the Calmar ratio. It is very similar to Sharpe ratio indicators, but instead of using the average drawdown as a measure of risk, max drawdown is used. It is one of the most widely used indicators for judging the performance of investment funds and portfolios, right up there with the Sharpe ratio and the Sortino ratio.
The Calmar ratio is a tool that was developed to assist in better comprehending whether or not a higher return is associated with a higher risk. It evaluates not only how profitable an investment is but also the risks that are associated with it. Better investments are generally agreed upon to be those that produce higher returns without taking on a correspondingly higher level of risk.
Calculating the profitability of an investment while taking into account its level of risk is the purpose of the Calmar ratio. If the ratio is high, it indicates that the return on the investment will be safe from experiencing significant drawdowns. On the other hand, a low ratio is indicative of a greater risk of drawdown in the portfolio.
The Calmar ratio is an effective method for evaluating the state of the portfolio held by an investment fund. A sudden drop in the ratio may indicate that the performance of the fund is influenced by the highest drawdown that has occurred in the fund within the past three years or the annual rate of return. The investors need to examine their holdings in order to determine whether or not the decline is attributable to increased uncertainty.
When backtesting trading strategies, the Calmar ratio is an important ratio to take into consideration. Additionally, the Sterling ratio and the Sharpe ratio can be utilised in conjunction with this metric. However, it is not possible to adjust it to different time horizons; as a result, portfolios must have the same period of backtesting in order to make use of the ratio.
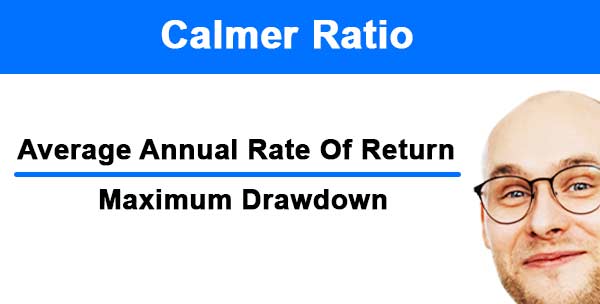
The Calmar ratio is a common metric that investors utilise in the process of selecting investments for their portfolios. The formula for calculating it involves dividing the compounded annual rate of return for the period by the maximum drawdown for the same period, and then dividing the result by 1. The performance of the investment is said to be less satisfactory the lower the Calmar Ratio. The performance of a fund, in addition to the risks it faces, is evaluated using the Calmar ratio. Terry W. Young is the author of The Calmar Ratio, which was published in 1991. The annual return is divided by the greatest peak-to-trough percentage of negative return to arrive at the Calmar ratio. Due to the fact that it is computed on a monthly rather than an annual basis, it presents a picture of the performance of a fund that is current. The Calmar ratio is a risk-adjusted measure that can be used to evaluate the performance of a hedge fund or commodity trading fund and determine whether or not the fund investable. In order to risk-adjust the return, the Sharpe ratio uses the standard deviation as a measure of risk, whereas the Calmar ratio uses the maximum drawdown as a measure of risk.
The Calmar ratio is a well-known risk-adjusted measure that investors implement into their decision-making process when selecting investments. The performance of the investment is said to be less satisfactory the lower the Calmar Ratio. A Calmar ratio of 1 plus is regarded as being good among traders, while a Calmar ratio of 3 plus is excellent, and a Calmar ratio of 5 plus is awesome.
During the process of backtesting trading strategies, the Calmar ratio is an important ratio that is calculated. The Sharpe Ratio and the Sterling Ratio are two other ratios that are frequently used in conjunction with this one. Because the Calmar ratio is not be modified to accommodate varying time horizons, all backtesting periods for portfolios that use the Calmar ratio should be the same length.
The following is the formula that can be used to determine the Calmar Ratio: Where: Rp = Portfolio return
In the process of evaluating hedge markets, the Calmar ratio is frequently applied. This metric considers not only a fund's profitability but also its exposure to risk. If the ratio is low, it indicates that the fund did poorly over a certain period.

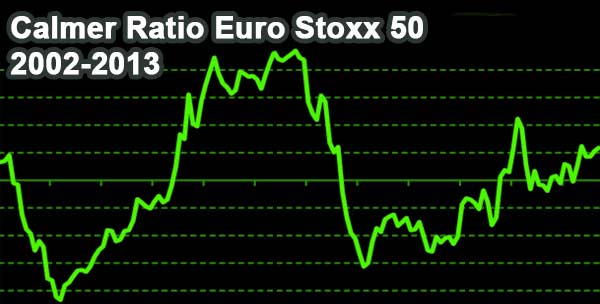
An improvement is indicated by a growing calmar ratio, which might be seen as an investment opportunity. The chart is for the Euro Stoxx 50 index. One can infer that since the Calmar Ratio is on the rise right now, asset managers ought to at the very least think about investing in stocks.
Research chart is from research by Schwarzbach, Christoph & Kunze, Frederik & Rudschuck, Norman & Windels, Torsten.
The annual rate of return (Rp) of an investment fund is compared to its maximum drawdown (drawdown) over a period of three years to determine a fund's Calmar ratio.
How well a hedge fund has done over the course of a year can be measured by looking at its annual rate of return. It indicates the extent to which the value of the portfolio gone up or down since the beginning of the reporting period.
A fund's maximum drawdown refers to the maximum loss it experienced from its peak to its trough during a particular investment period. To calculate it, take the fund's highest value and subtract its lowest value, then divide that number by the index's highest value. This gives you the value of the fund relative to the index at its highest point.
A financial indicator known as the Calmar ratio is applied in the evaluation of both commodity trading advisors and hedge funds. Before making any investments, it is easier for investors to evaluate the potential risks involved. When evaluating the performance of an investment using the Calmar Ratio, risk-adjusted basis is an extremely important factor to consider.
At the turn of the 20th century, economist William Young developed the Sterling ratio, which was later published by Ernst von der Sternberg as the Calmar ratio. The Calmar ratio is a modified version of the Sterling ratio.
The Calmar Ratio is an easy-to-understand ratio that provides investors with information about the maximum drawdown, which is the maximum price decline that is potentially possible in the market. Because the computation was performed over a span of three years, the information obtained from this basis is considered to be more trustworthy as a result of this timeframe.
The annual return is divided by the highest peak-to-trough percentage of negative return to arrive at the Calmar Ratio. The user is required to choose linear bars but has the option to adjust the input (close) and period length. The definition of this indicator is further expressed in the condensed code that is given in the calculation that is presented below.
Refer to the Calmar Ratio. It is possible to derive the formula for the Calmar Ratio by applying it to the following points:
The following list of points will explain the distinction between: 1. The following is the formula for the Sharpe Ratio: Where,
The Sharpe ratio is more widely used than the Calmar ratio, which calculates risk based on the maximum drawdown and was introduced for the first time in 1991. The Sharpe ratio adjusts the return based on the standard deviation of the risk, whereas the Calmar ratio uses the maximum spread that exists between the risk and return.
The Calmar ratio is a measurement that can be used to evaluate the performance of a commodity or hedge fund and determine whether or not it is worthwhile to invest in those types of funds. It is a better measure than simply looking at the risk number on its own, because it takes into account the return that is generated for each unit of risk.
When analysing the performance of a fund, analysts and fund managers frequently make use of a number of different ratios, and this is one of the most important ones. When determining the performance of a fund, it is necessary to take into consideration a number of other macro factors in addition to government policies, news events, federal bank policies, and SEC regulations.